Know where to focus. Prove the impact.
Data-driven capability assessments across your product and engineering teams — so you know exactly where to focus, and can prove what's working.
Assess. Diagnose. Plan. Accelerate.
A systematic approach to finding and fixing what's slowing you down.
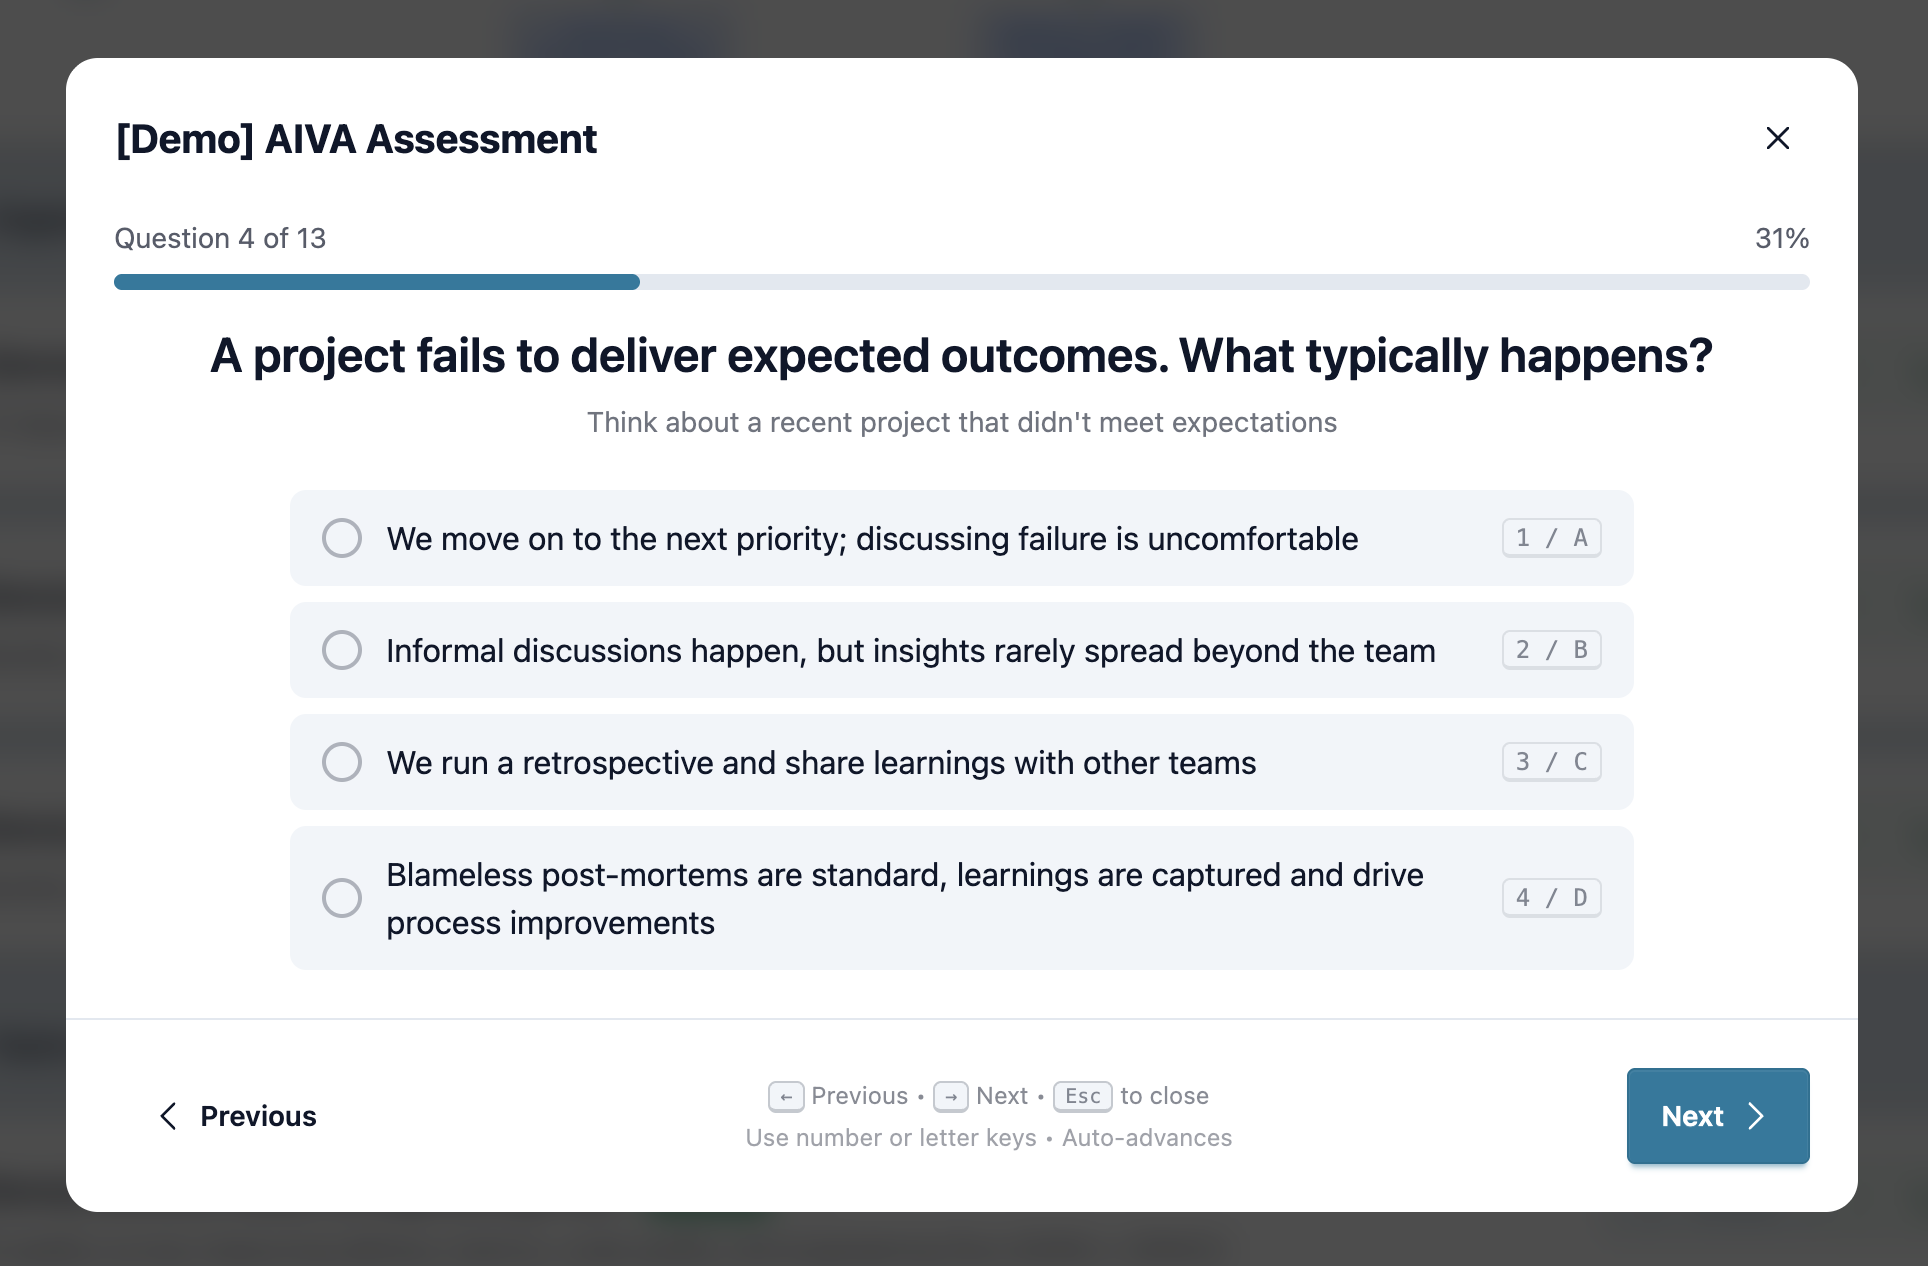
Assess
Survey key team members and leadership with low friction role oriented surveys
Highlights
Role-based surveys use concrete examples, letting AIVA infer maturity across the value stream flow and capability areas. Input from different roles adds multiple perspectives on each area, improving accuracy.
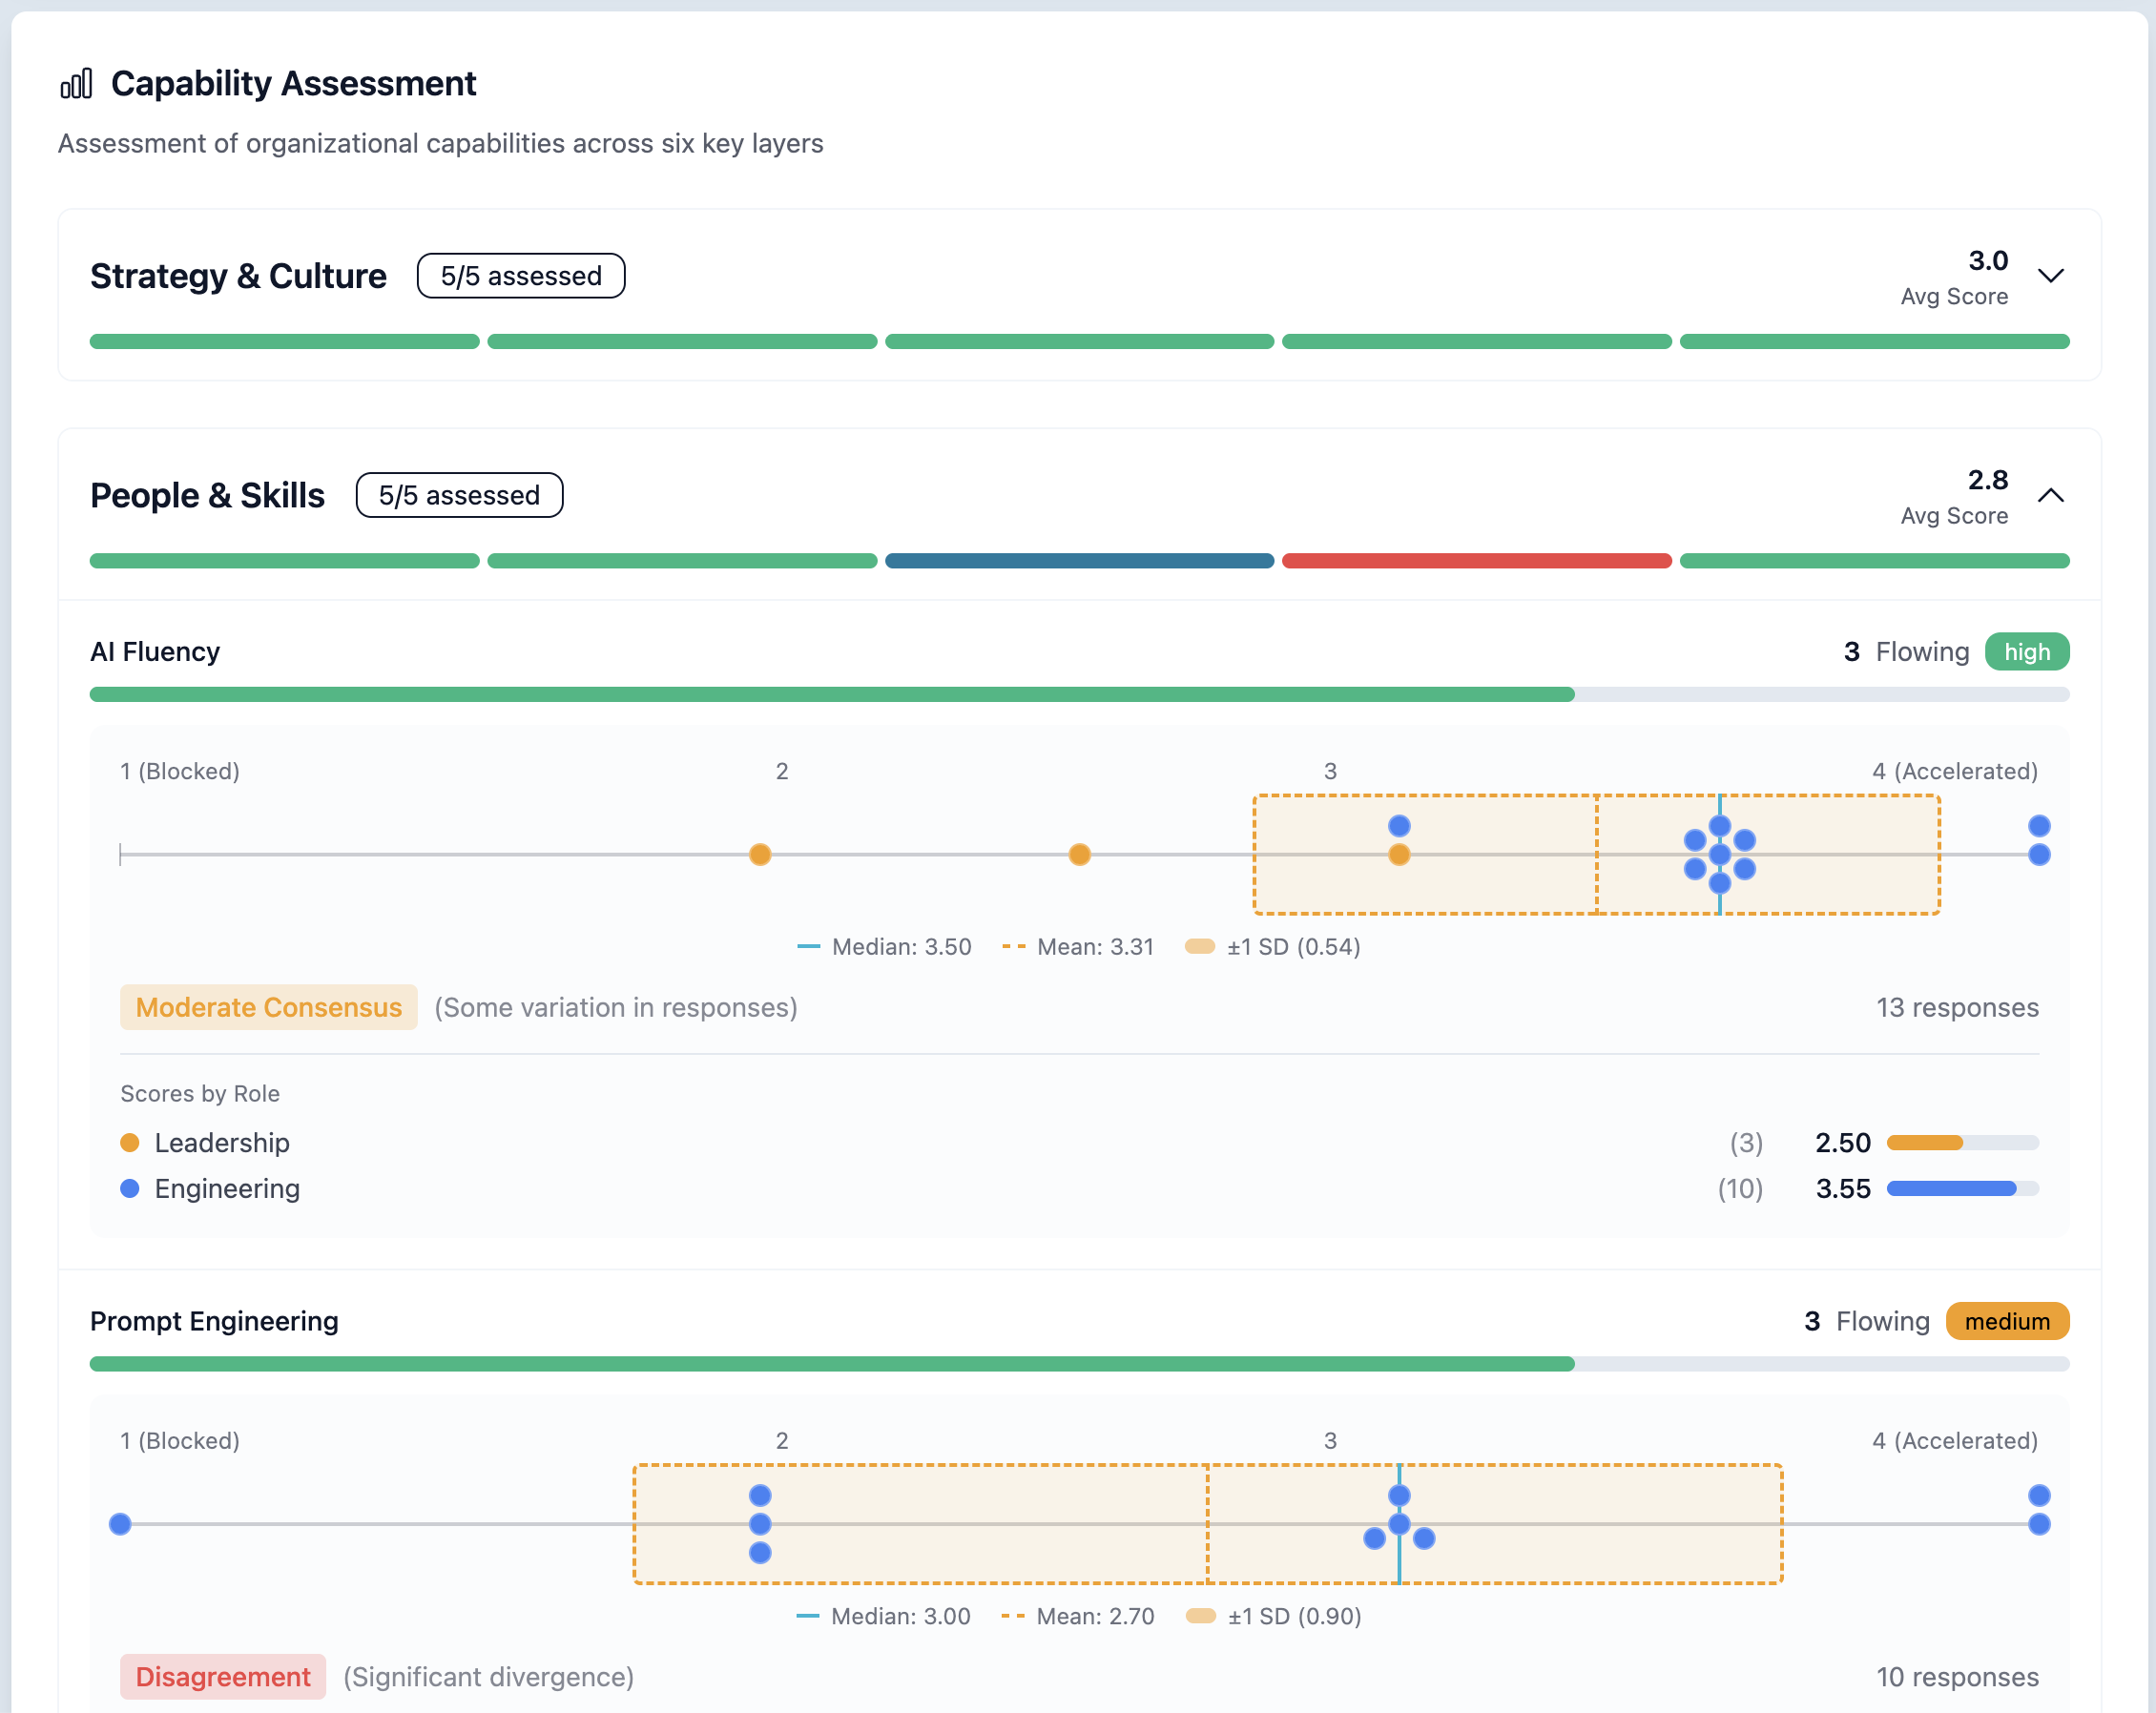
Diagnose
Identify bottlenecks and capability gaps constraining your value flow
Highlights
Scorecards show value stream phases and capability layers side by side, with overall averages to spot the biggest constraints quickly. Repeating the survey makes progress visible over time.
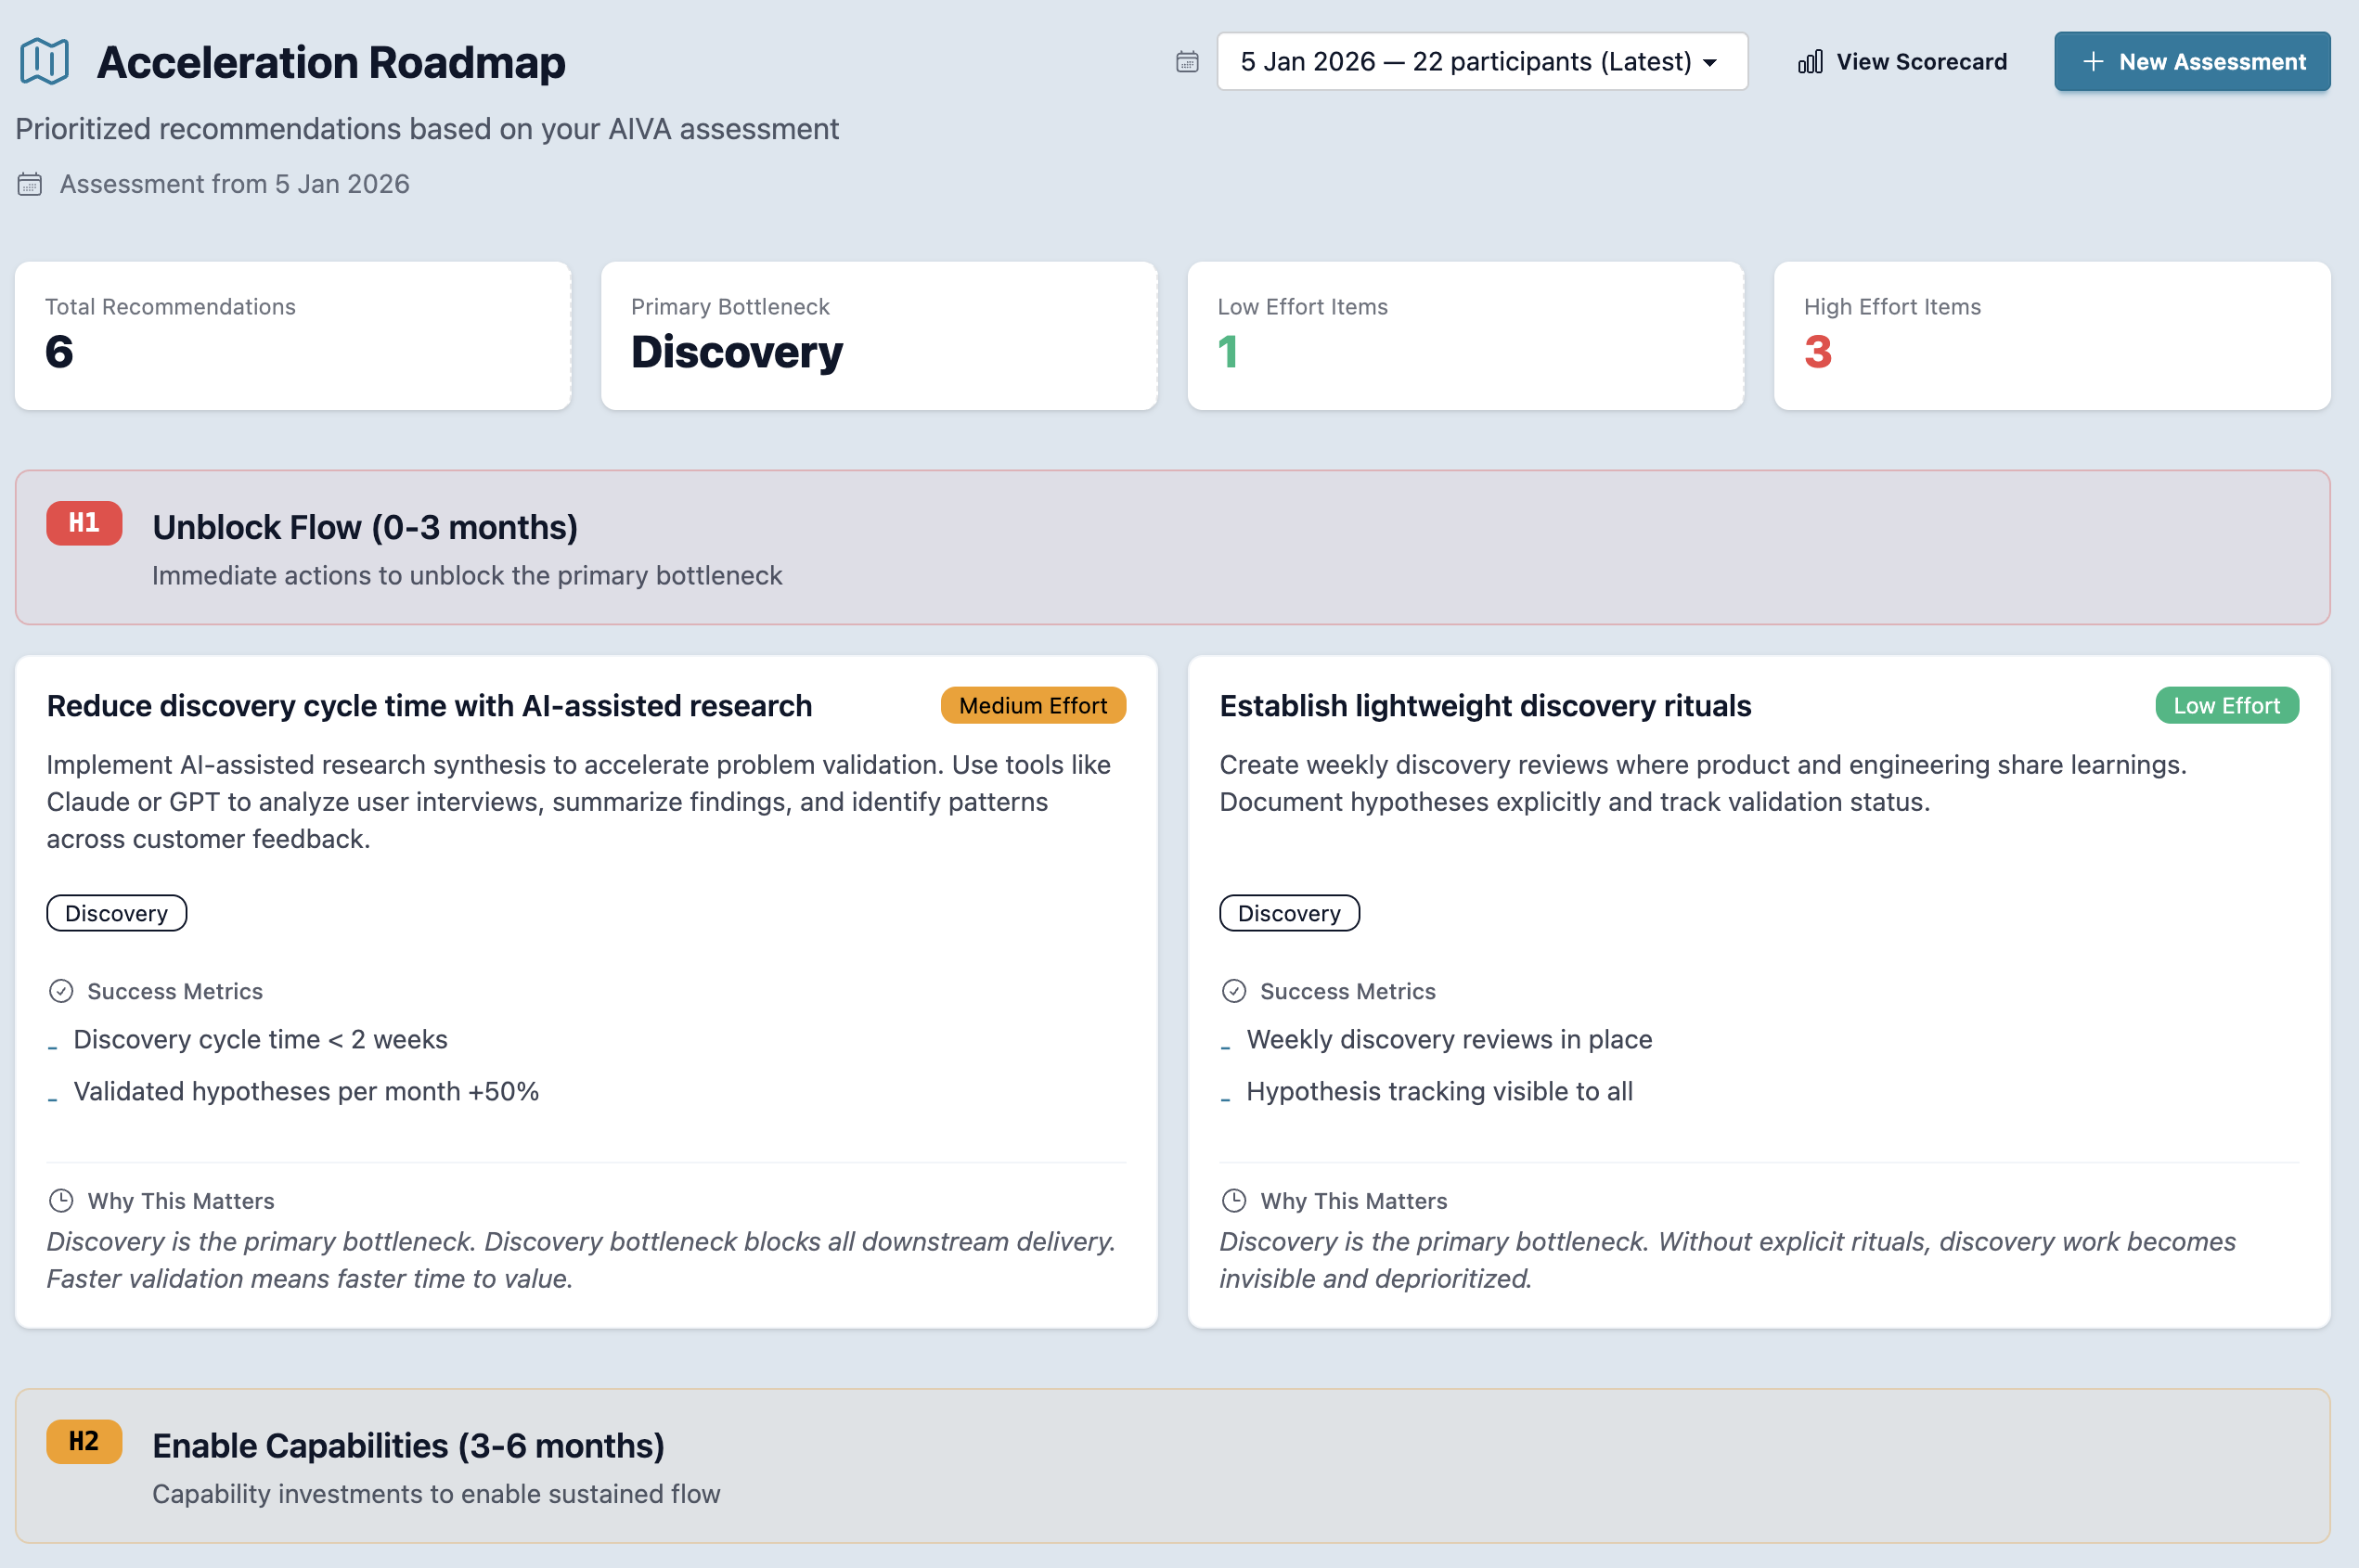
Plan
Get targeted recommendations for maximum impact improvements
Highlights
The roadmap starts with the primary bottleneck, then targets the capability gaps that unlock flow. Actions are sequenced into clear horizons so teams know what to do first and what to tackle next.
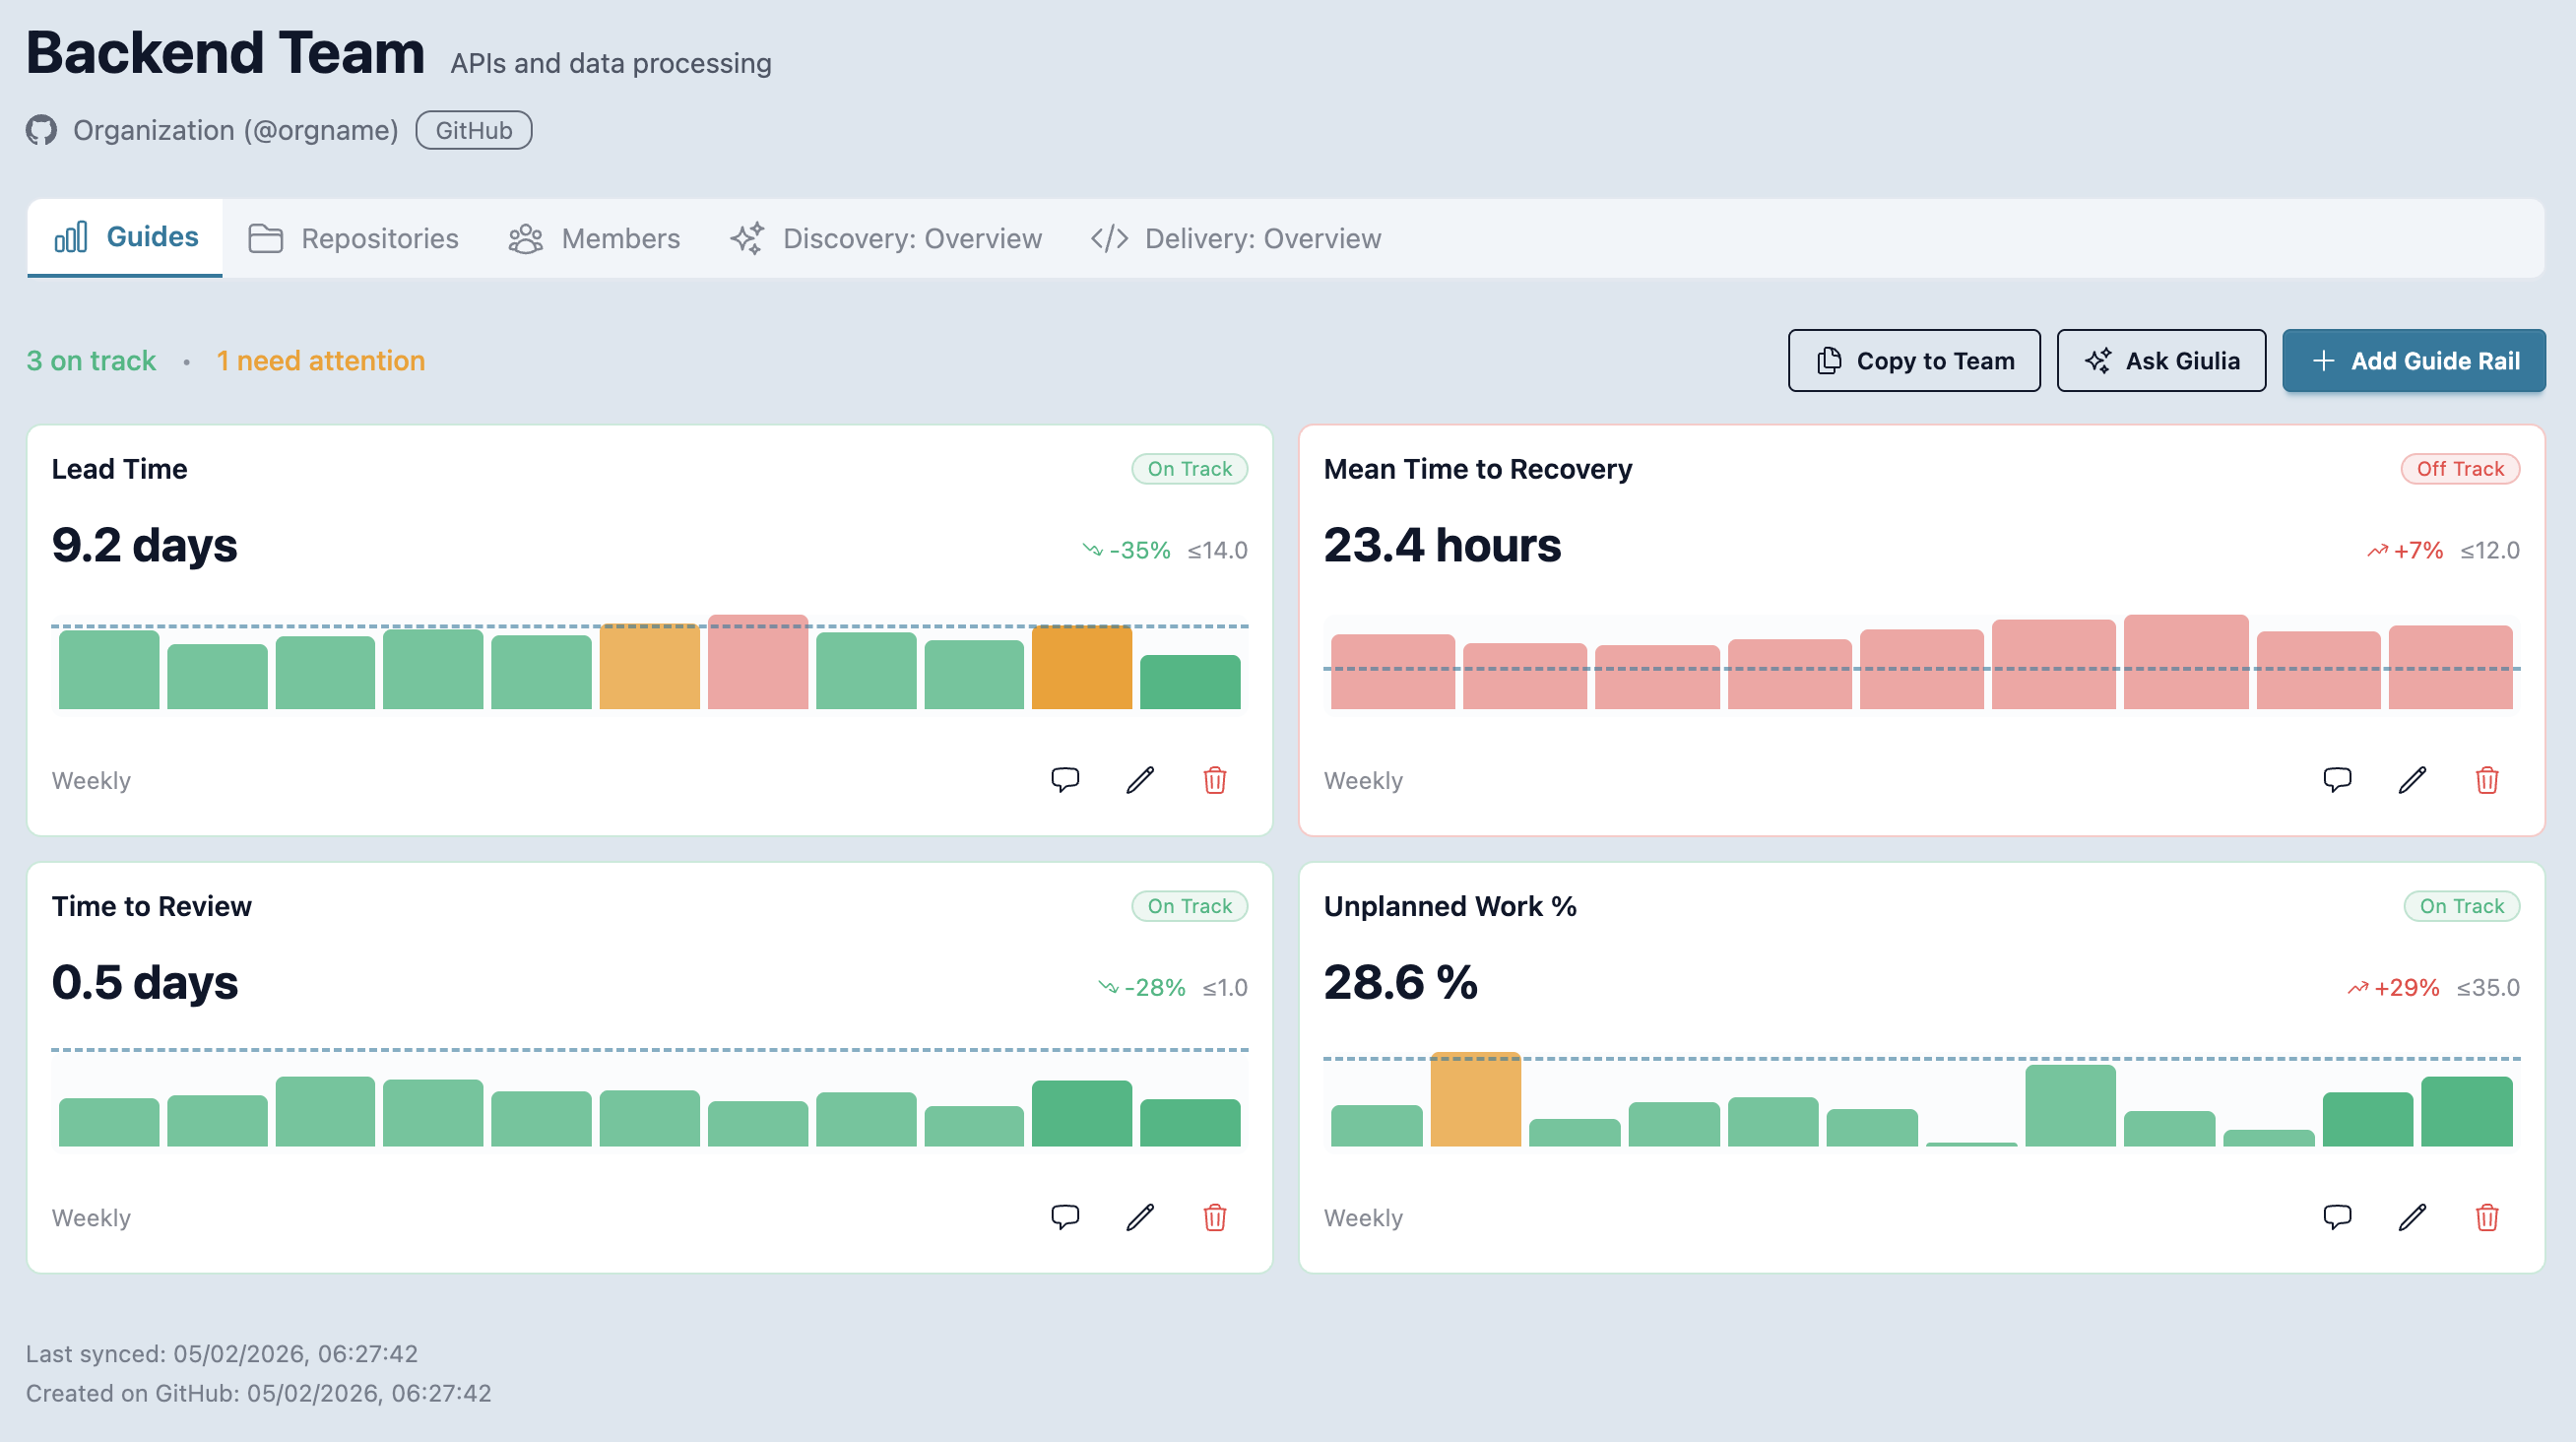
Accelerate
Track improvement over time with continuous measurement
Highlights
Set Guide Rails to turn the roadmap into clear team-level goals, metrics, and check-ins. Teams get lightweight guidance between assessments so progress stays on track.
Six layers that enable AI-driven value
Assess and understand the state of six capability areas.
Strategy & Culture
AI vision, leadership commitment, innovation mindset
People & Skills
AI fluency, prompt engineering, continuous learning
Ways of Working
AI-augmented workflows, pair programming, code review
Technical Platform
AI tools, infrastructure, security, access controls
Governance & Enablers
Policies, measurement, quality standards, compliance
External Interfaces
Vendors, community, open source, partnerships
Our assessment identifies exactly where to focus - not just what you have, but what's constraining your acceleration.
Most tools only measure Delivery. We measure the complete picture.
From research and problem validation through to shipping and impact — a bottleneck in either half constrains everything.
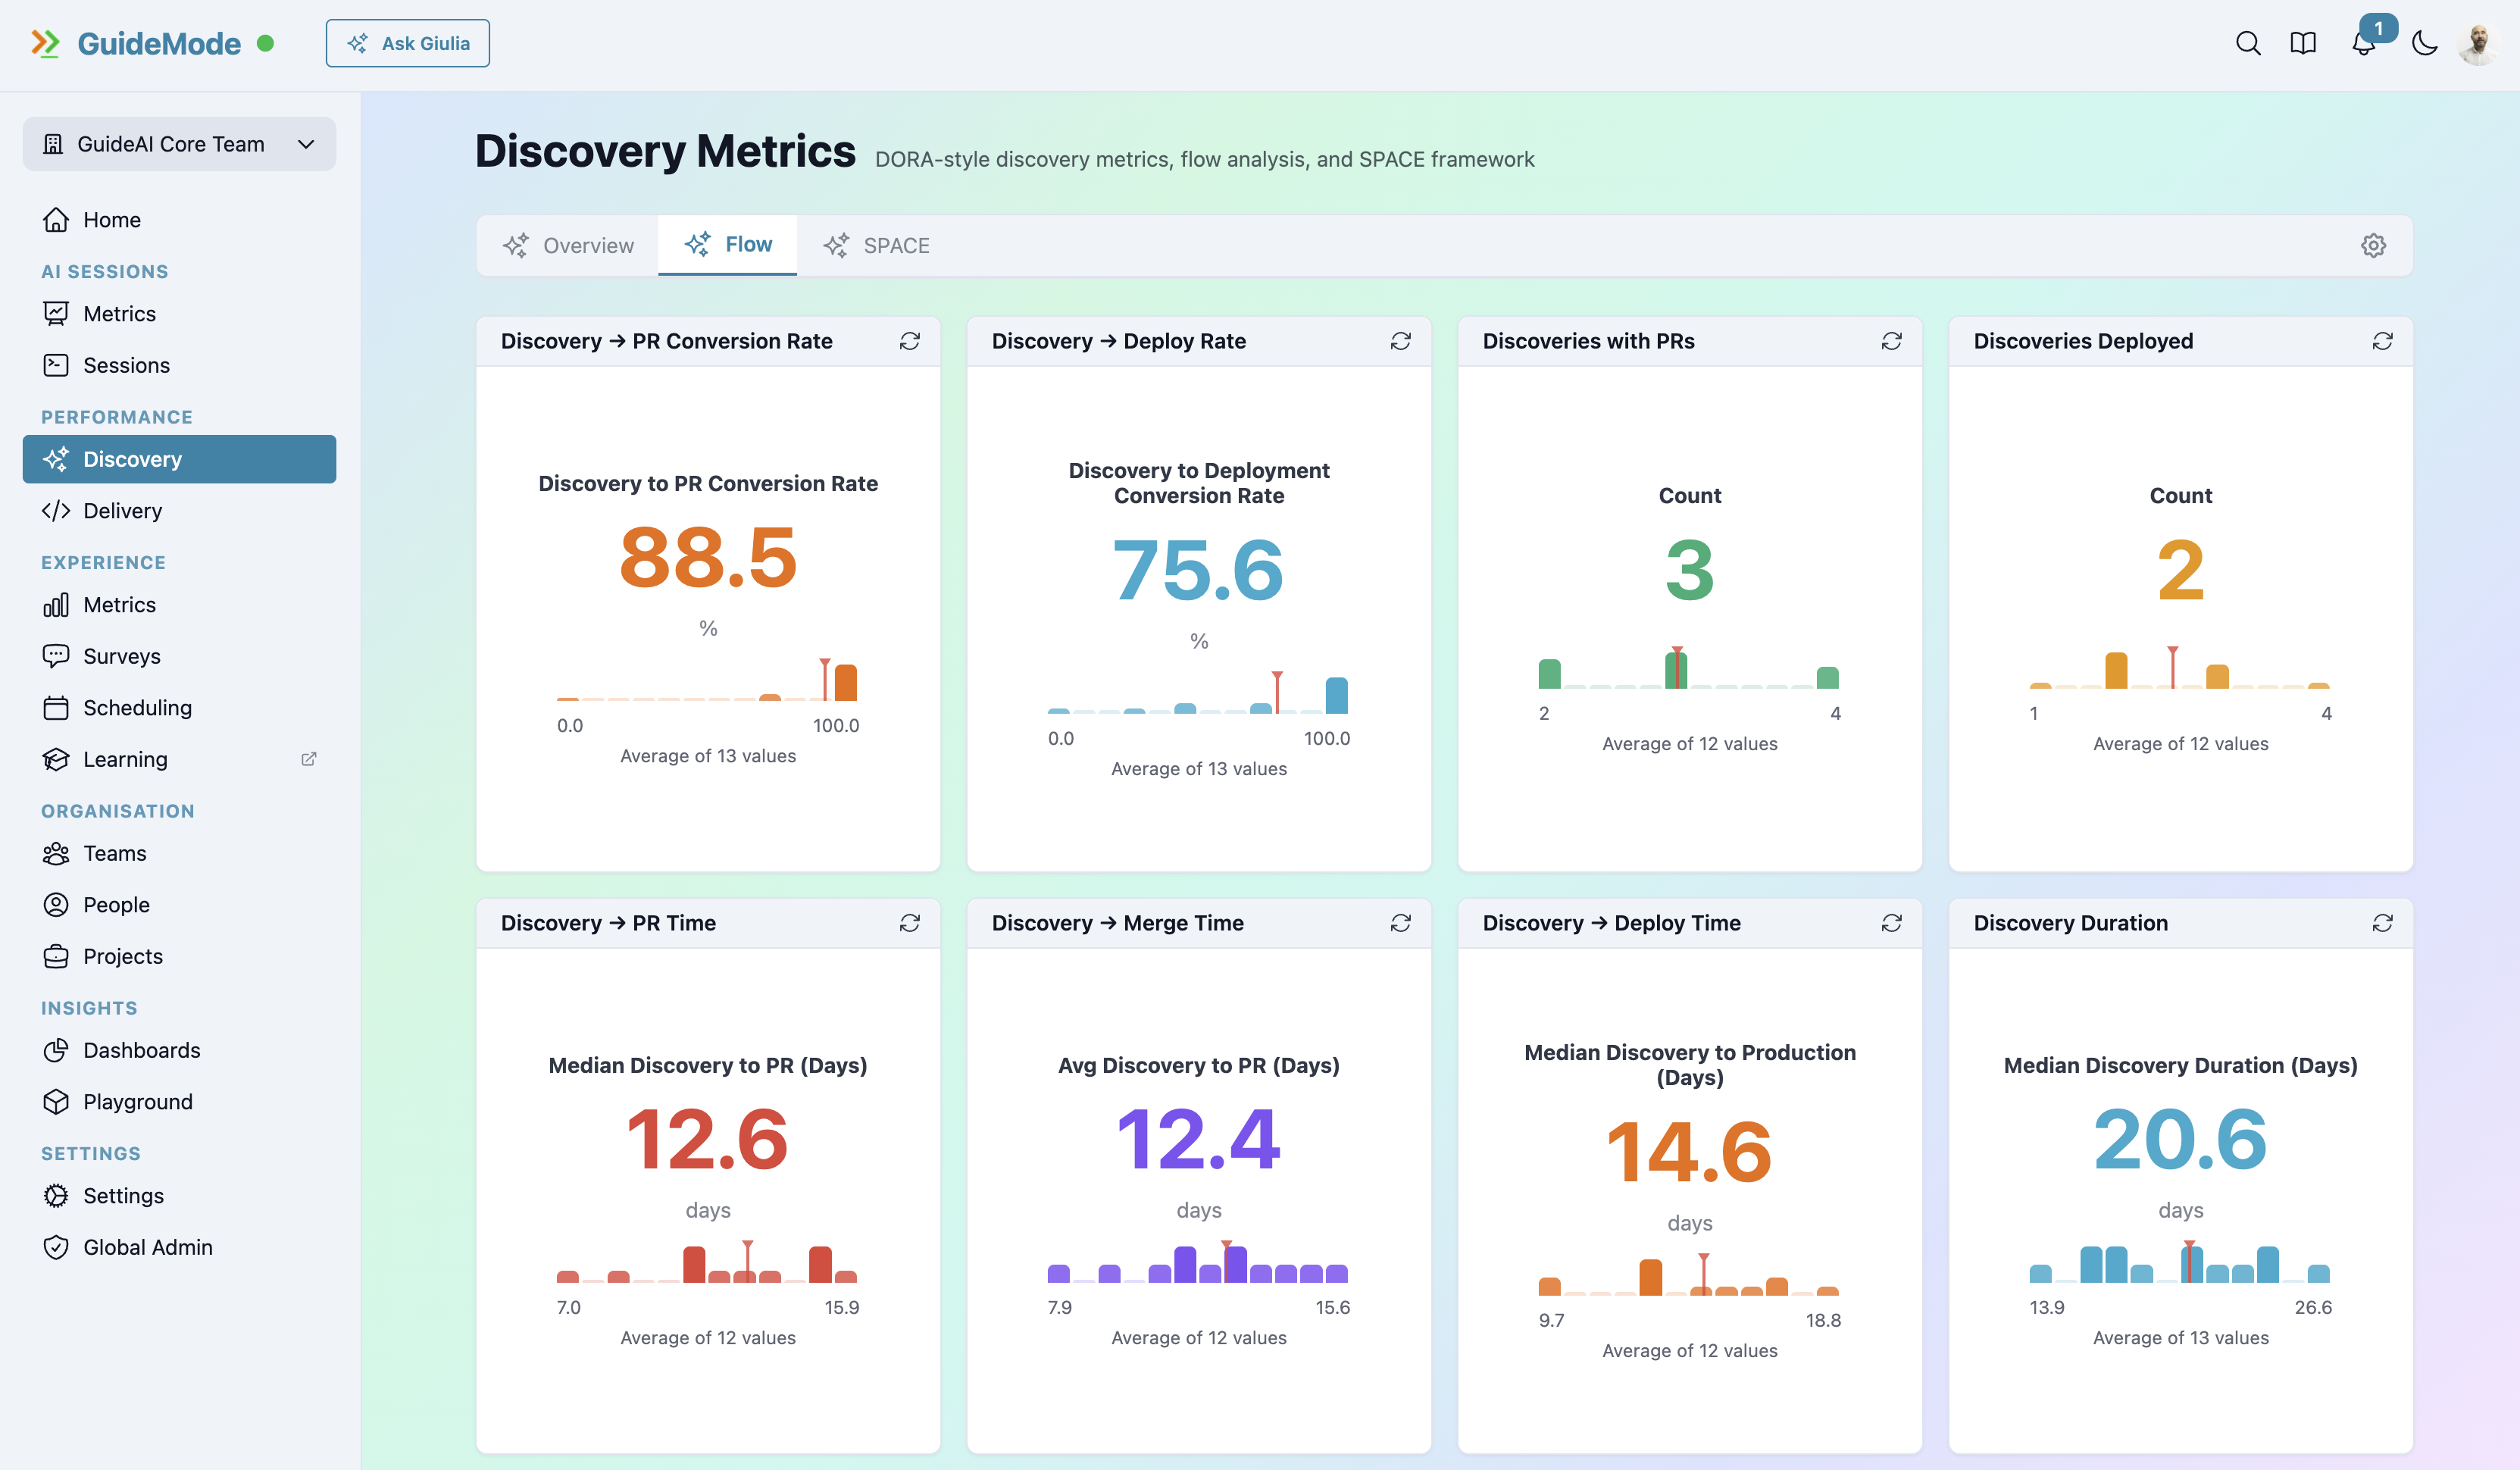
Discovery Analytics
Measure your discovery process effectiveness
Most DX platforms only measure delivery. But shipping fast doesn't matter if you're building the wrong thing. GuideMode tracks the complete picture: from initial research and customer discovery through validation — to see the full journey.
- Research & design validation
- Customer interview metrics
- UX research velocity
- Discovery cycle time
- Experiment frequency
- Build-measure-learn cycles
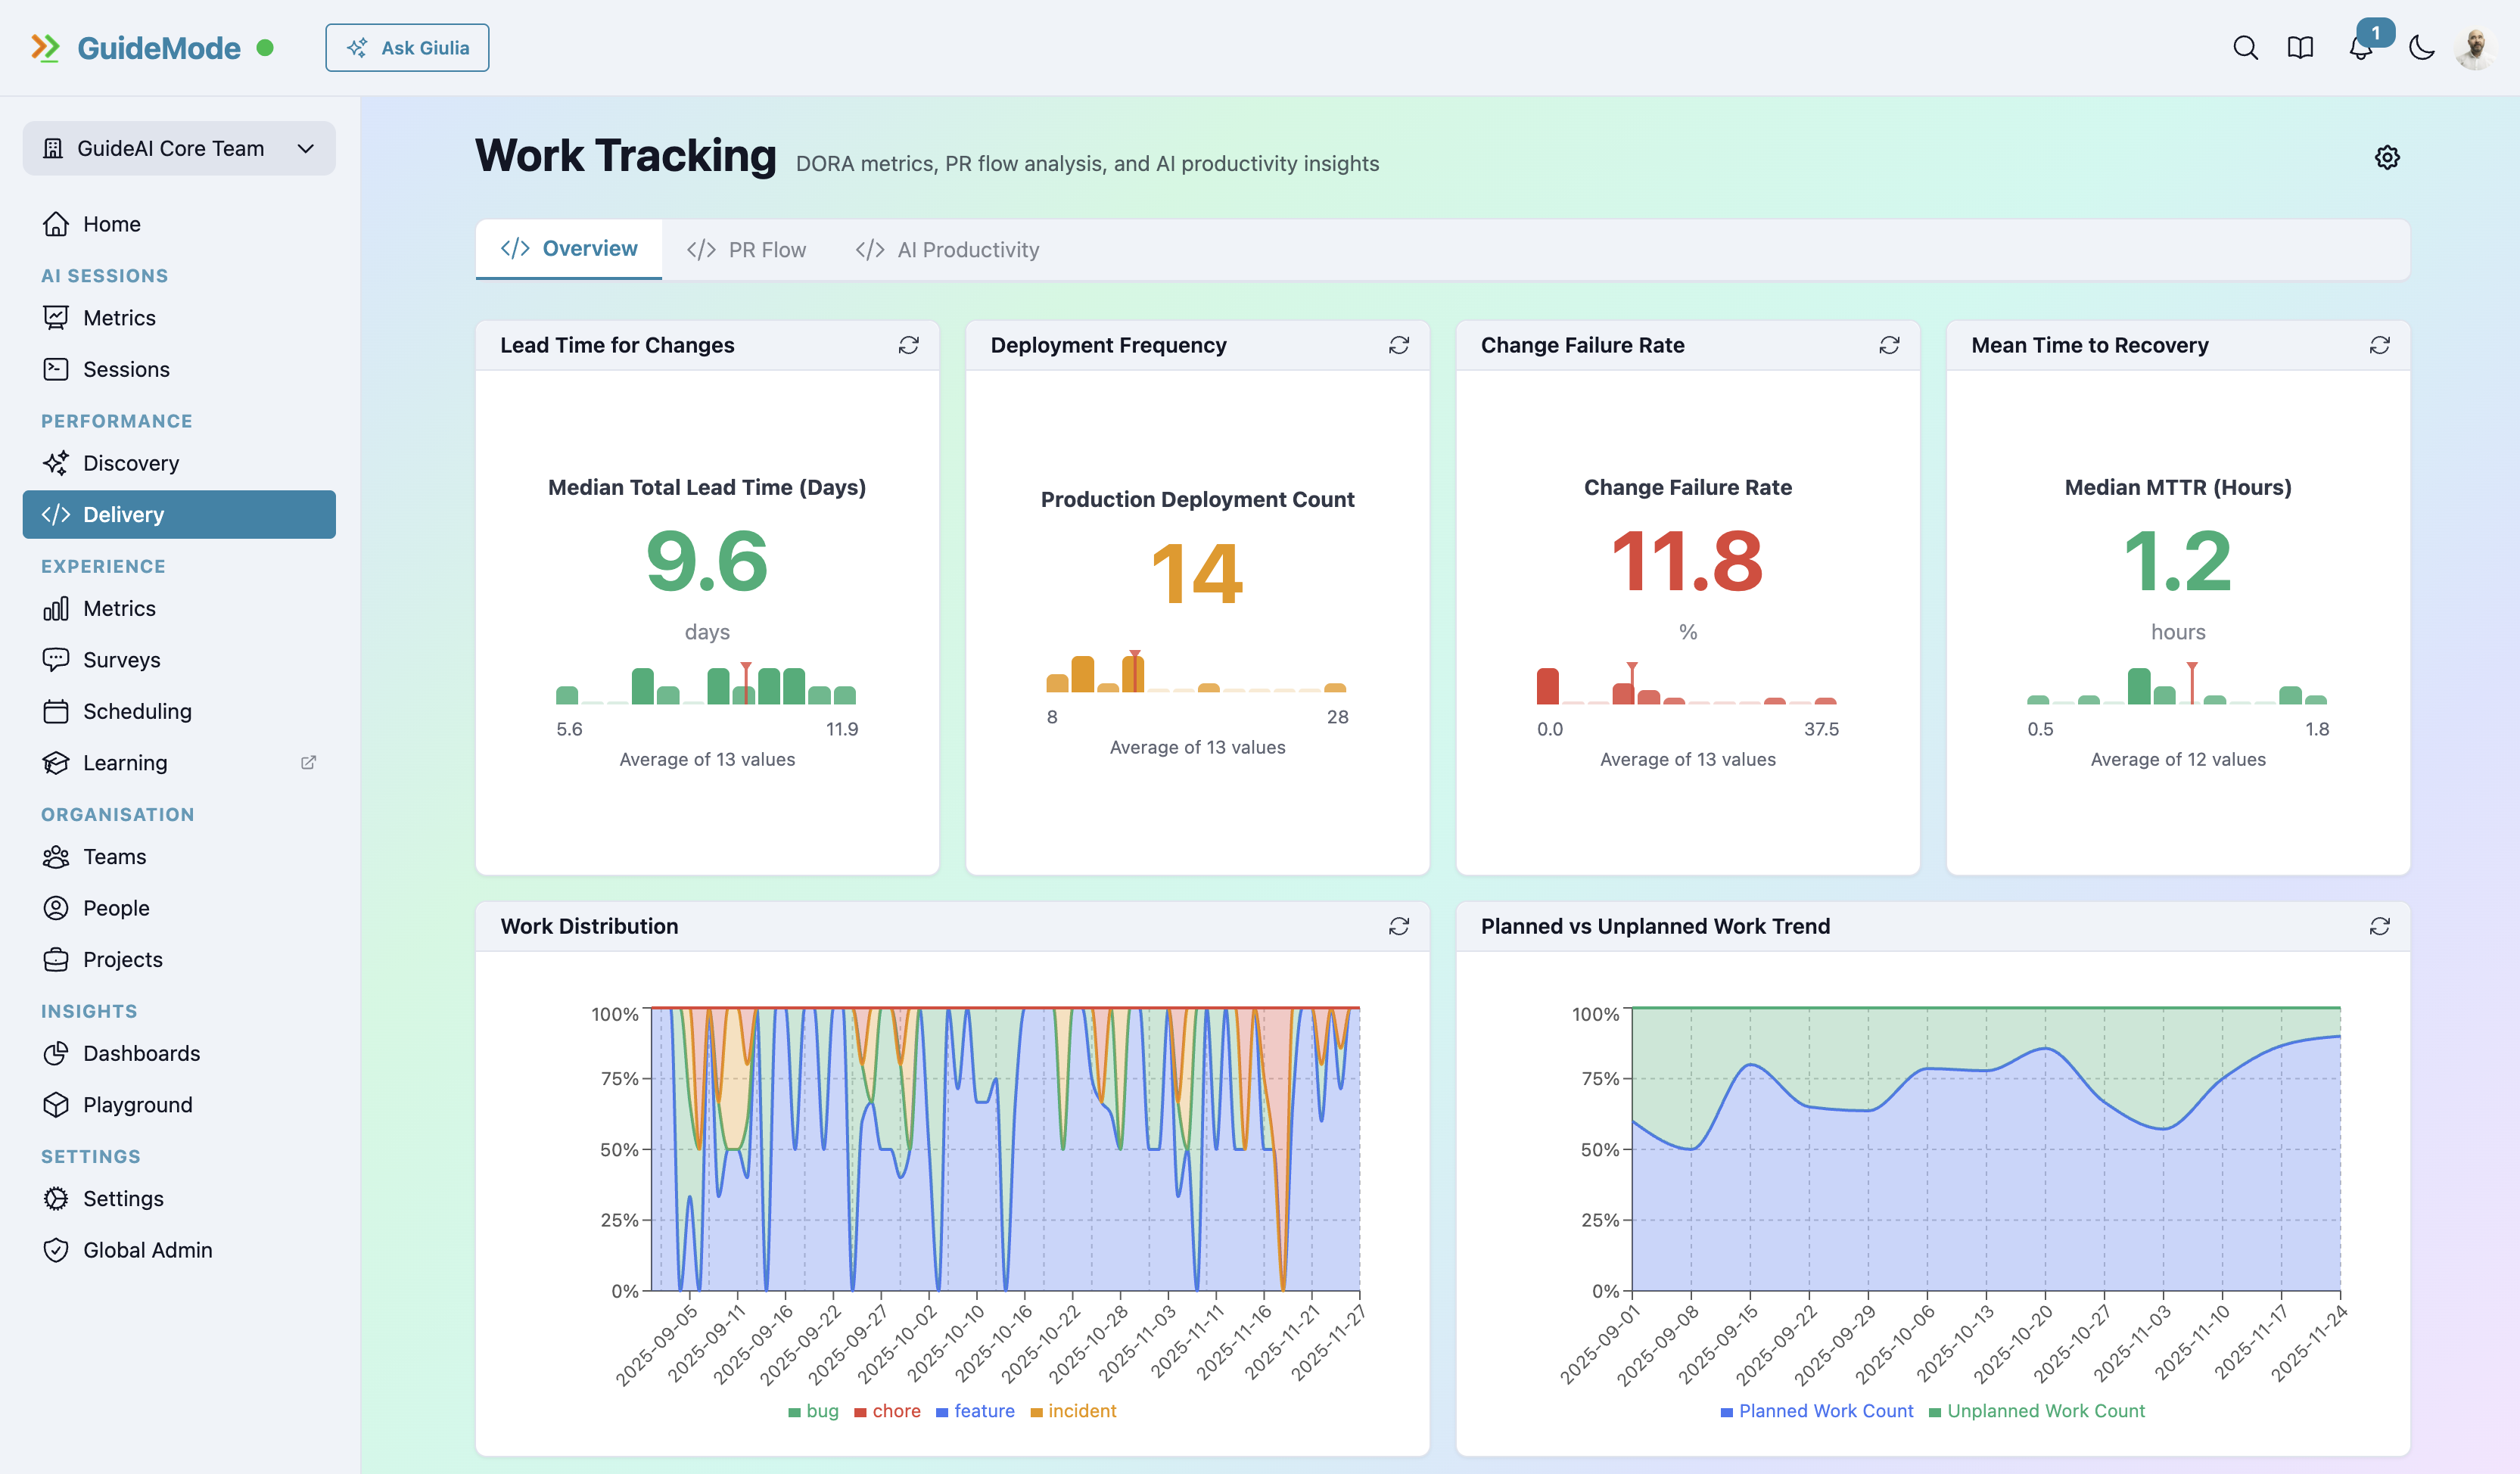
Delivery Metrics
Complete visibility from idea to impact
All four DORA metrics, flow tracking, and comprehensive deployment analytics. Track deployment frequency, lead time, MTTR, and change failure rate — with 48 PR measures and 53 issue tracking analytics. to connect delivery to discovery outcomes.
- AI session intelligence (5 providers)
- PR analytics (48 measures)
- DORA metrics (all 4)
- Deployment tracking
- Change failure rate
- Flow analysis
Most platforms focus only on Delivery. But fast delivery of the wrong thing is waste. Great discovery without delivery means ideas never ship. Measure the complete flow.
Connected to Your Stack
Measure real delivery data alongside capability assessments
Work Tracking
GitHub
Sync organizations, teams, repositories, pull requests, issues, and deployments. Full DORA metrics and flow analytics.
View detailsJira
Team and user synchronization with real-time webhooks. Issue type mapping and rich state tracking.
View detailsLinear
Real-time issue synchronization, automatic team linking, and smart issue classification.
View detailsNotion
Map Notion databases to work items. Flexible column mapping with auto team assignment and smart sync.
View detailsAI Providers
Claude Code
Complete session tracking including plan mode, todo lists, git operations, tool usage, and conversation analysis.
Cursor
Full interaction monitoring with conversation tracking, code suggestions, file operations, and session effectiveness.
GitHub Copilot
Session analytics covering code completions, acceptance rates, usage patterns, and productivity metrics.
Gemini Code Assist
Complete conversation tracking, tool usage monitoring, code generation analytics, and session success metrics.
OpenCode
Session monitoring with interaction tracking, code output analysis, and effectiveness measurements.
Frequently Asked Questions
What is AIVA?
AIVA is our framework for diagnosing bottlenecks in your value stream, identifying capability gaps, and accelerating outcomes. Unlike static readiness assessments, AIVA measures your rate of improvement and shows you exactly where to invest for maximum impact.
What are Discovery and Delivery?
Discovery encompasses research, problem validation, and solution design - ensuring you're building the right thing. Delivery covers development, deployment, and validation - shipping solutions and measuring their impact. Value flows through both phases, and a bottleneck in either constrains the whole stream.
What are the six Capability Lens layers?
The six layers are: Strategy & Culture (AI vision and leadership), People & Skills (AI fluency and learning), Ways of Working (AI-augmented workflows), Technical Platform (tools and infrastructure), Governance & Enablers (policies and measurement), and External Interfaces (vendors and community). Each layer builds on the others - capability gaps compound.
How is this different from AI readiness assessments?
Readiness assessments tell you where you are at a single point in time. That snapshot becomes stale immediately. We measure acceleration - your rate of improvement over time. We identify what's slowing you down and show you exactly where to invest. Readiness ends. Acceleration compounds.
Which AI coding tools are supported?
GuideMode tracks sessions from Claude Code, Cursor, GitHub Copilot, Gemini Code Assist, and OpenCode. Each provider is tracked with comprehensive session-level metrics including conversation patterns, tool usage, code changes, and productivity indicators.
Ready to demonstrate AI value?
Diagnose what's blocking value. Target capabilities. Accelerate outcomes.